Welcome to Semarchy xDM Integrator Analytics.
This guide contains information about how to use Semarchy xDM Integrator Analytics and perform production tasks.
Preface
Audience
Document Conventions
This document uses the following formatting conventions:
| Convention | Meaning |
|---|---|
boldface |
Boldface type indicates graphical user interface elements associated with an action, or a product specific term or concept. |
italic |
Italic type indicates special emphasis or placeholder variable that you need to provide. |
|
Monospace type indicates code example, text or commands that you enter. |
Other Semarchy Resources
In addition to the product manuals, Semarchy provides other resources available on its web site: http://www.semarchy.com.
Obtaining Help
There are many ways to access the Semarchy Technical Support. You can call or email our global Technical Support Center (support@semarchy.com). For more information, see http://www.semarchy.com.
Feedback
We welcome your comments and suggestions on the quality and usefulness
of this documentation.
If you find any error or have any suggestion for improvement, please
mail support@semarchy.com and indicate the title of the documentation
along with the chapter, section, and page number, if available. Please
let us know if you want a reply.
Overview
Using this guide, you will learn how to use Semarchy xDM Integrator Analytics in order to:
-
Connect to runtime engines and logs databases.
-
View sessions.
-
Configure production connections and publish deliveries to runtime engines.
Installing Semarchy xDM Integrator Analytics
Prerequisite
Semarchy xDM Integrator Analytics has the following requirements:
-
A JEE Web Application Server such as Tomcat (7+) or JBoss (6+) is installed and configured.
-
A Java Virtual Machine or Java Development Kit version 1.7 and above, supported by the Application Server is installed.
-
A folder is available on the server to store parameters and data for Semarchy xDM Integrator Analytics.
Semarchy xDM Integrator Analytics runs on any operating system meeting these requirements.
Installation
Semarchy xDM Integrator Analytics is shipped as .war file that is deployed on the application server.
Before proceeding:
-
Make sure that the application server uses a Java version 1.7 or above
-
Define a
SEMARCHY_DI_ANALYTICS_WEBAPP_HOMEenvironment variable, pointing to the folder into which Semarchy xDM Integrator Analytics will store its parameters and repository information.
For the SEMARCHY_DI_ANALYTICS_WEBAPP_HOME variable, it is preferable to use a folder separated from the installation folder of the application server. It is recommended to set up a backup process for this folder.
|
The name of the SEMARCHY_DI_ANALYTICS_WEBAPP_HOME variable can include the port into which the Semarchy xDM Integrator Analytics instance runs. For example: SEMARCHY_DI_ANALYTICS_WEBAPP_HOME_8081 to specify a second installation of Semarchy xDM Integrator Analytics. Use this mechanism when there are two instances of Semarchy xDM Integrator Analytics running in the same server.
|
Rights Management
Semarchy xDM Integrator Analytics authentication uses application server’s authentication and roles. You must declare users, roles and assign roles to users in the application server.
The following roles are supported by Semarchy xDM Integrator Analytics for defining the connected user’s privileges:
-
analyticsConnect: Connection privilege. This role is required to connect the application, and is mandatory.
-
analyticsAdmin: Super administrator privilege. This role overrides any other roles, and a user with this role has all privileges.
-
analyticsParameterConsult: Privilege to view the parameters.
-
analyticsParameterAdmin: Privilege to change the parameters.
-
analyticsSessionConsult: Privilege to view the sessions.
-
analyticsSessionAdmin: Privilege to manage the session organization and create session views.
-
analyticsSessionAction: Privilege to change the session status (start, stop, restart, delete).
-
analyticsRuntimeConsult: Privilege to view the runtime engines.
-
analyticsRuntimeAdmin: Privilege to manage the runtime engines.
-
analyticsRepositoryConsult: Privilege to view the repositories
-
analyticsRepositoryAdmin: Privilege to manage the repositories
Configuring Apache Tomcat
Apache Tomcat Setup
To setup Semarchy xDM Integrator Analytics on Apache Tomcat:
-
Declare the
SEMARCHY_DI_ANALYTICS_WEBAPP_HOMEenvironment variable in the profile of the user who will start the application server, or declare this variable in the/bin/setenv.bator/bin/setenv.shfile. -
Add the users and roles to Tomcat, for example by modifying the
/conf/tomcat-users.xmlfile in the Apache Tomcat installation directory. -
Start the Tomcat server using the
/bin/startup.bator/bin/startup.shscript -
Copy the .war file into Tomcat’s
/webappsfolder. Tomcat will automatically deploy the application.
Managing users and roles in Apache Tomcat
To add your users and roles when using a default Tomcat configuration, you must modify the /conf/tomcat-users.xml file in the Apache Tomcat installation directory.
The following example shows how to configure a new administrator user, who has two Semarchy xDM Integrator Analytics roles - analyticsAdmin and analyticsConnect - and two Tomcat roles - admin-gui and manager-gui -.
<tomcat-users>
<user name="youruser"
      password="yourpassword"
      roles="admin-gui, manager-gui, analyticsAdmin, analyticsConnect"
      />
</tomcat-users>
Configuring JBoss
JBoss 7
JBoss 7 Setup
To setup Semarchy xDM Integrator Analytics on JBoss 7:
-
Declare the
SEMARCHY_DI_ANALYTICS_WEBAPP_HOMEenvironment variable in the profile of the user who will start the application server. -
Add the users and roles in JBoss 7 (see the note below).
-
Start JBoss 7.
-
Copy the .war file provided by Semarchy in the JBoss deployments folder. JBoss will auto-deploy the application.
Managing users and roles in JBoss 7
-
Add the two files named
analytics-users.propertiesandanalytics-roles.propertiesin the domain or standalone folder according to your installation. -
In the
analytics-users.propertiesfile add a user with its password as shown in the example below:-
myuser=mypassword
-
-
In the
analytics-roles.propertiesfile add the roles for this user as shown in the example below:-
myuser=analyticsConnect,analyticsSessionConsult
-
-
Add the following text to the
standalone.xmlordomain.xmlfile according to your installation:
<security-domain name="analyticsRealm">
  <authentication>
    <login-module code="UsersRoles" flag="required">
      <module-option name="usersProperties"
             value="${jboss.server.config.dir}/analytics-users.properties"/>
      <module-option name="rolesProperties"
             value="${jboss.server.config.dir}/analytics-roles.properties"/>
    </login-module>
  </authentication>
</security-domain>| Contact your JBoss administrator for more information about adding users to JBoss. |
JBoss 6
JBoss 6 Setup
To setup Semarchy xDM Integrator Analytics on JBoss 6:
-
Declare the
SEMARCHY_DI_ANALYTICS_WEBAPP_HOMEenvironment variable in the profile of the user who will start the application server. -
Add the users and roles in JBoss 6 (see the note below).
-
Start JBoss 6.
-
Copy the .war file provided by Semarchy in the JBoss deployments folder. JBoss will auto-deploy the application.
Managing users and roles in JBoss 6
-
Add the two files named
analytics-users.propertiesandanalytics-roles.propertiesin theserver\default\conf\prop\folder in your JBoss installation folder. -
In the
analytics-users.propertiesfile add a user with its password as shown in the example below:-
myuser=mypassword
-
-
In the
analytics-roles.propertiesfile add the roles for this user as shown in the example below:-
myuser=analyticsConnect,analyticsSessionConsult
-
-
Add the following text to the
server\default\conf\login-config.xmlfile:
<application-policy name="analyticsRealm">
  <authentication>
    <login-module code="org.jboss.security.auth.spi.UsersRolesLoginModule" flag="required">
      <module-option name="usersProperties">
         props/analytics-users.properties
      </module-option>
      <module-option name="rolesProperties">
         props/analytics-roles.properties
      </module-option>
      <module-option name="unauthenticatedIdentity">
         anonymous
      </module-option>
    </login-module>
  </authentication>
</application-policy>| Contact your JBoss administrator for more information about adding users to JBoss. |
User Interface Overview
The following picture provides an overview of Semarchy xDM Integrator Analytics' graphical user interface:
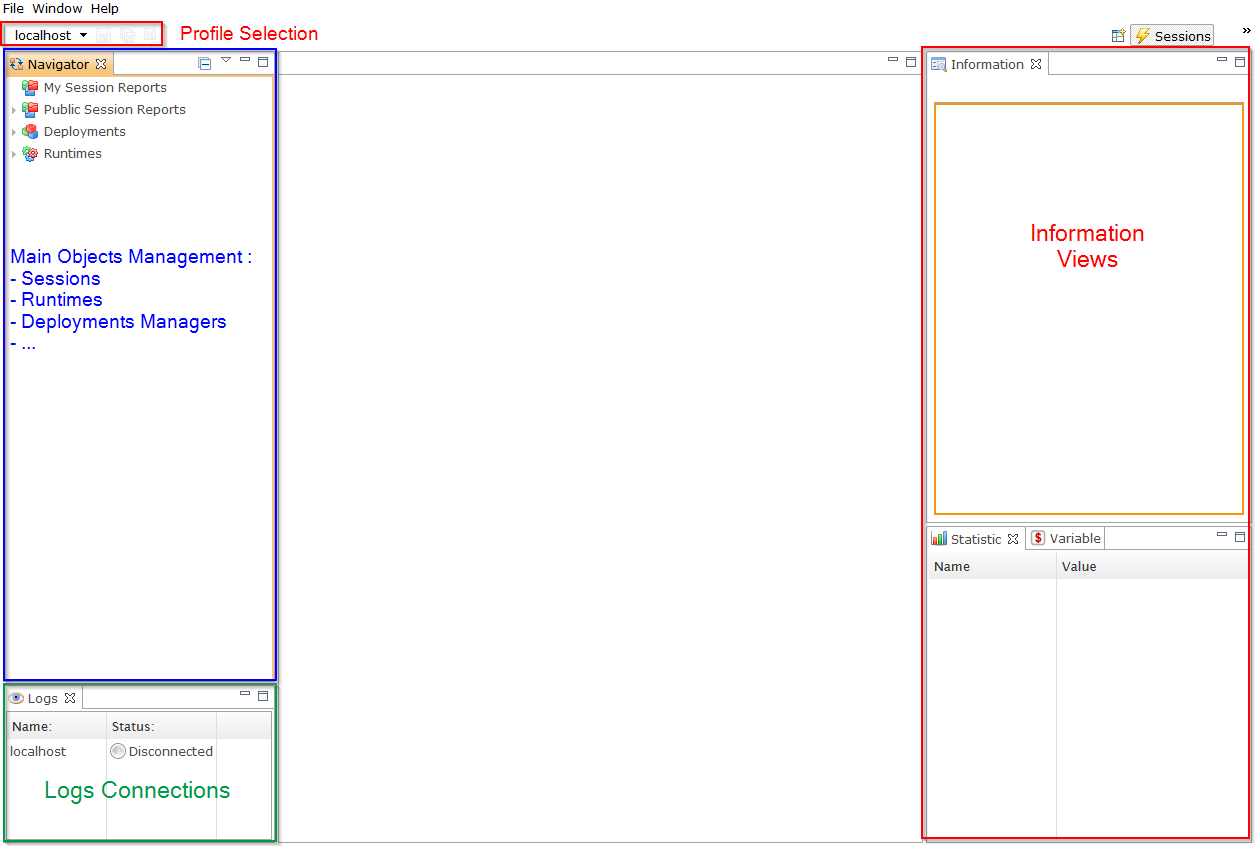
Setting Up Semarchy xDM Integrator Analytics
You can configure Semarchy xDM Integrator Analytics through the Windows→Parameters menu.
This menu opens the Parameters editor. In this editor, you can configure runtime engines, databases and profiles:
-
Runtime Engines are the engine running the data integration sessions. They can be accessed remotely by Semarchy xDM Integrator Analytics.
-
Databases centralize logs from engine. Log databases are setup when a large number of logs is generated by the integration sessions and need to be preserved.
-
Profiles group databases and runtime engines, and provide a view including only the database and runtime (as well as the logs) in this group. For example, the Production profile will include all the runtime engines and databases used for production purposes.
Defining Runtime Engines
To define a runtime engine:
-
In the Parameters editor, select the Runtime Tab.
-
Click the Add button.
-
Enter a Name, the Host and the RMI Port to connect the runtime.
-
Optionally set a User and *Password*Ò if the Runtime is secured
-
Select the Show in logs selection option if you want the runtime to appear in the profile selection box in the toolbar.
-
Select the Hide in navigator option to hide the runtime in the selection Navigator view.
-
Select the Disable log database proxy box, to prevent retrieving session information from this runtime engine.
-
Test the connection using the Test button.
-
Press CTRL+S to save the parameters.
| When the configuration is complete, make sure to select the runtime engine in the dropdown menu under the main menu bar in order to use it. |
| Make sure that the IP ports specified is accessible (open) on the machine hosting the runtime. By default this port is 42000. |
If you configure Semarchy xDM Integrator Analytics to connect to the log databases via datasources then you should check the Disable log database proxy option for each runtime engine. Besides, if your runtime engine is configured to use a log database different from the default one, you should copy the corresponding JDBC drivers to the SEMARCHY_DI_ANALYTICS_WEBAPP_HOME/jdbc folder.
|
Defining Log Databases
To define a log database:
-
In the Parameters editor, select the Log Databases Tab.
-
Click the Add button.
-
Enter the Name of the logging database displayed in Semarchy xDM Integrator Analytics.
-
Define the connection:
-
If you want Semarchy xDM Integrator Analytics to perform a direct JDBC connection to the database, enter the Driver, URL, User and Password connection information.
-
If you want Semarchy xDM Integrator Analytics to connect using a JDBC datasource, enter the Datasource Name.
-
-
Enter the name of the Schema storing the logging database.
-
Enter the Prefix of the logging tables in this database.
-
Select the Show in logs selection if you want the database name to appear in the profile selection box in the toolbar.
-
Test the connection using the Test button.
-
Press CTRL+S to save the parameters.
| Make sure that the IP ports specified is accessible (open) on the machine hosting the logging database. |
| You can automatically fill in the database information by connecting to a runtime using this logging database. Click the Autoinit button and then provide the runtime connection information, then click OK. |
Do not forget to copy the JDBC driver corresponding to the log databases to the SEMARCHY_DI_ANALYTICS_WEBAPP_HOME/jdbc folder.
|
Defining Profiles
Profiles are used to gather Sessions from a set of runtime engines and log databases.
For example, a "Production" profile is created to administer all runtimes and logging databases dealing with a production environment.
To define a profile:
-
In the Parameters editor, select the Profiles Tab.
-
Click on the Add button.
-
Provide a Name for this profile.
-
Click the button at the right of the Log Providers field. A dialog appears.
-
In this dialog, select the runtime engines and logging database that you want to add to this profile and then click OK.
-
Press CTRL+S to save the parameters.
The profile is automatically added in the profile selection box in the toolbar.
Check the Default Profile option if you want to use the Profile as default for users that do not have any profile selected.
| All Runtimes and All Log Databases are virtual providers allowing to dynamically gather data from all the configured Runtimes or Log Databases. |
Defining Statistics
You can add and remove statistics from the Statistics tab. Any numeric variable can become a statistic that will appear in the Statistics view.
Defining preferences
In the Preferences tab, you can manage and configure the behavior of Semarchy xDM Integrator Analytics. The following properties are available:
Property |
Default |
Description |
Display builds under Packages |
false |
If true, every build will be displayed under its Package node. If false, builds will only be displayed under their respective Specification node. |
Auto connect Runtimes |
true |
Analytics will maintain a connection to the Runtimes if this property is set to true. If the connection to a Runtime fails a new try is performed after the delay specified in 'Runtime connection retry interval'. |
Runtime connection retry interval |
60 seconds |
Time to wait before retrying to connect to a Runtime that Analytics failed to contact. |
Auto refresh enabled by default |
true |
Set it to true to enable auto-refresh on Session Reports. |
Session refresh Frequency |
60 seconds |
Refresh delay of Session Reports when Auto-Refresh is enabled. |
HTTP Sessions timeout |
5 minutes |
Analytics session timeout. If no operations are performed during this delay, the session will be closed. |
Enable check connections on Configurations |
false |
A menu allowing to test the Configuration connections is added on the Deployment Manager builds if this property is set to true. |
Managing Sessions
Defining Session Reports
Session Reports are used to gather, filter and visualize a list of sessions based on the criteria defined by the user.
Creating Session Reports
To create a new Session Report:
-
Right-click the Public Session Reports node
 in the Navigator view
  and select New Session Report
 -
Enter a name for the new session report.
-
Edit the criteria, as explained in the Session Report Criteria section.
-
Press CTRL+S to save your report and then click the Refresh
 button.
Sessions that meet your criteria only now appear in the table.
|
The My Session Reports topic can be used to create Session Reports only visible by the current user.
|
Auto refresh
If you enabled auto refresh mode in the Preferences, the session report will be refreshed periodically using the specified delay. You can then manage this mode on each session reports by clicking on the auto-refresh button:
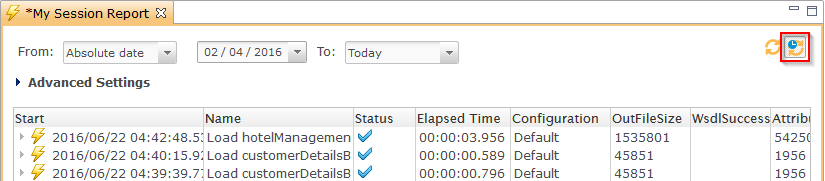
-
The
 icon indicates that auto refresh is started
 -
The
 icon indicates that auto refresh is paused
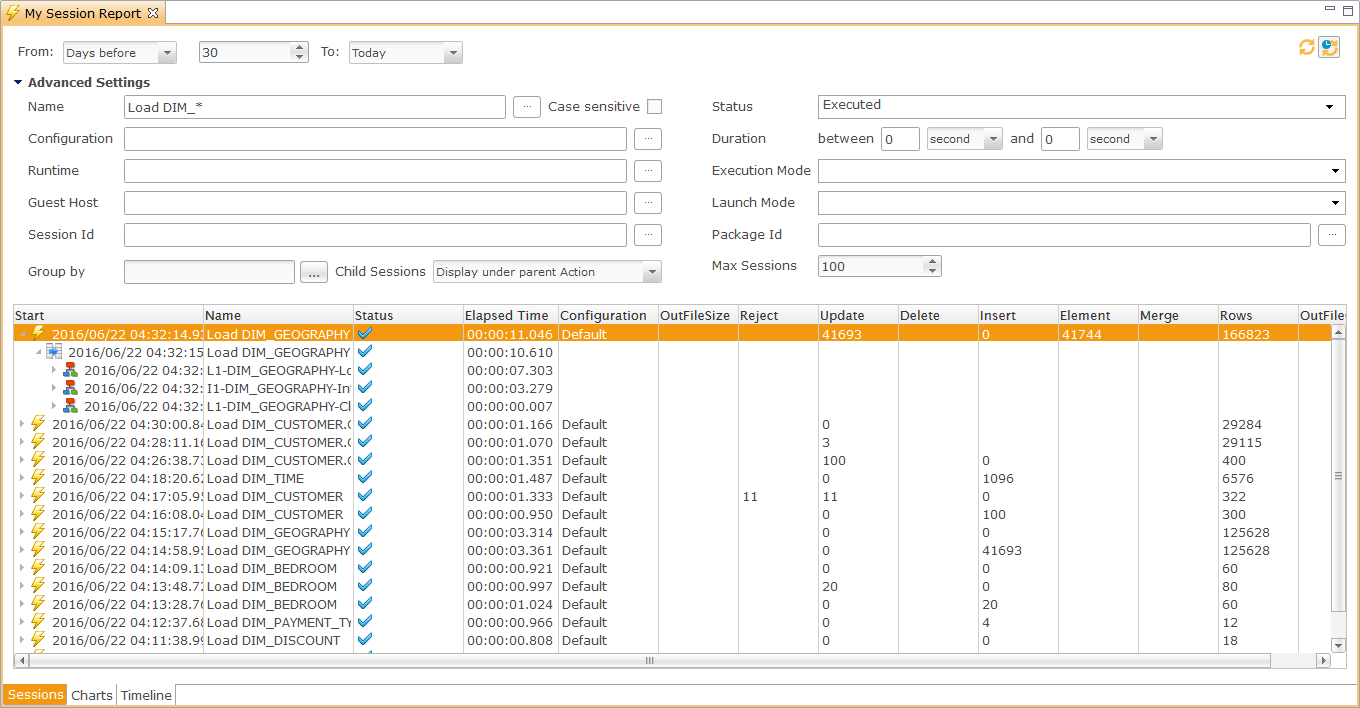
Session Report Criteria
The session report criteria include the following parameters (some of them are under the Advanced section).
Basic Settings
-
From and To allow setting up the time range for the report:
-
Today displays sessions executed Today (from) or until (To) Today.
-
Yesterday displays sessions executed from or until yesterday.
-
Absolute allows defining specific days for the range limits.
-
Days Before allows you to specify a number of days in the past. Note that if you select Days Before, the To field is not used.
-
Advanced Settings
-
Name allows filtering by session name. You can use
*to define a pattern. For example*CRM*filters all session having the CRM string in their name. -
Configuration: Sessions with the specified Configuration(s) will be displayed.
-
Runtime: Sessions with the specified Runtime(s) will be displayed.
-
Guest Host: Sessions with the specified guest host(s) will be displayed. The guest host is the hostname of the machine on which the session has been executed.
-
Session Id: Sessions with the specified Id will be displayed.
-
Child Sessions: Allows to choose whether to display or not the sessions' child session in the tree, and how. Possible values are:
-
Hidden: Child sessions are not displayed.
-
Display under parent Action: Child sessions are displayed under the Action that executed it.
-
Displayed as standalone Sessions: Child sessions are displayed as standalone in the list of sessions.
-
Displayed under parent Session: Child sessions are displayed in a branch under the parent session.
-
-
Status allows filtering by session status. You can select one or more statuses from the following list:
-
Prepared: Prepared but not executed sessions.
-
Running: Running sessions.
-
Executed: Executed sessions.
-
Error: Sessions in error.
-
Killed: Sessions killed by the user
-
Dead: Dead sessions, that is sessions that never finished and are considered as dead by Semarchy xDM Integrator Analytics.
-
-
Sessions allows choosing a maximum number of sessions to display.
-
Groups allow grouping the sessions according to the following fields: Status, Name, Runtime, Guest Host, Execution Mode, Launch Mode and Configuration. Note that in the Group By dialog, you can order the grouping fields. For example, you can group sessions by name then by status.
-
Duration: Only the session fulfilling the specified duration will be displayed.
-
Execution Mode: Sessions with the specified Execution Mode(s) will be displayed. Valid execution modes are:
-
Memory: The session has been executed in memory in the Runtime.
-
Autonomous: The session has been executed outside of the Runtime.
-
-
Launch Mode: Sessions with the specified Launch Mode(s) will be displayed. Valid launch modes include:
-
Designer: The session has been executed from the Designer.
-
Schedule: The session has been executed automatically by a schedule.
-
Web Interactive: The session has been executed from Analytics.
-
Engine Command: The session has been executed from the Runtime Command utility (E.g. Using the 'execute delivery' command).
-
Command Line: The session has been executed from command line (E.g. with startdelivery.bat).
-
Web Service: The session has been executed from the Runtime’s REST or SOAP web services.
-
Action: The session has been executed from the 'Execute Delivery' Process Action.
-
Restart: The session has been restarted.
-
-
Package Id: Sessions with the specified package Id(s) will be displayed.
-
Max Sessions: Maximum number of sessions displayed.
Selecting Table Columns
Right-click the sessions table header in the session report editor to select those of the columns that you want to display.
| Changes are saved for each user using cookies. If cookies are not allowed in the browser, the changes are discarded when the user’s session finishes. |
Using the Views
Other views provide information about a session selected in a list of sessions:
-
The Statistic view
 displays the aggregated statistics of the session.
 -
The Variable view
 displays the main variables of the session
 -
The Information view
 displays general information about the session.
Viewing Session Details
Drilling into Session Details
You can view the details of a session by double-clicking on this session in the list. This opens a new editor, displaying the session’s steps are organized in an execution tree. You can expand this tree and select any of the nodes in the tree.
Using the Views
When a node is selected in the tree, the views display information about this specific node:
-
The Statistic view
displays the aggregated statistics for the selected step. -
The Variable view
displays the variables for the selected step. -
The Information view
displays general information about the selected step. If the step contain executed code (for example a SQL statement), the executed code tab also appears in this view (in the Executed  tab), as well as the Error messages if any.
Using the Session Details Editor
In session detail editor, the toolbar contains the following buttons to select the steps displayed in the tree or manage the session.
-
Message
 displays user-defined messages. These messages are defined by the process designer.
 -
Details displays the detail of a session (it is selected by default)
-
Warnings
 only displays the steps having raised warning messages.
 -
Errors
 only displays the steps having raised error messages.
 -
Stop
 stops the current sessions if it is running.
 -
Restart
 restarts the current session when it is in an error status.
 -
Refresh button
refreshes the session tree.
Restarting or Stopping a session
To stop or restart a session:
-
In the session list or in the session detail editor, right-click and then select Restart
or Stop . -
In the session details editor, in the toolbar, click the Restart
or Stop buttons.
Viewing Deliveries' Documentation
If deliveries were built through a package including the documentation, all the sessions created from theses deliveries will be linked to the documentation.
The documentation is accessed from the following locations:
-
In the sessions list, right-click the session and then select Documentation. The documentation of the delivery opens.
-
In the session details editor, right-click a node and then select Documentation. The documentation of the selected step opens.
-
In the deployment manager, by a right-click the package including and then select Documentation. The documentation of the package opens.
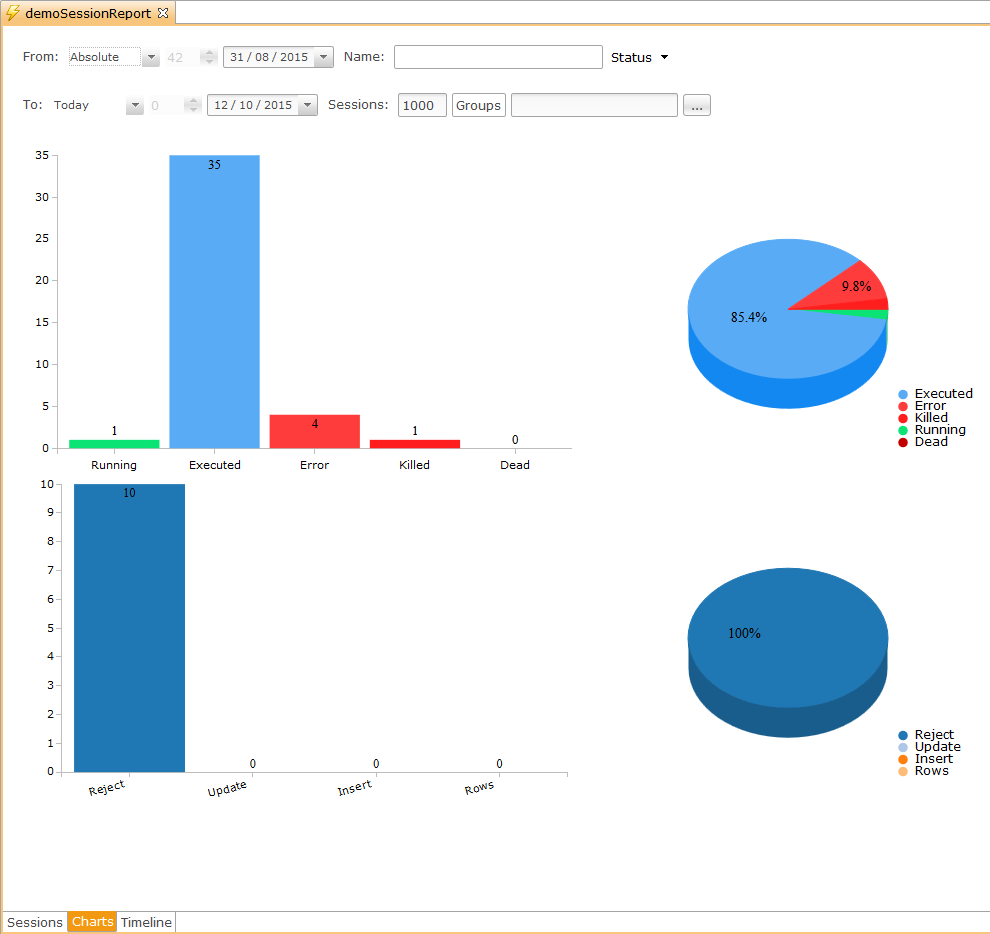
Sessions Visualization
The Charts tab
The Charts tab displays graphs that summarize the statistics of the sessions.
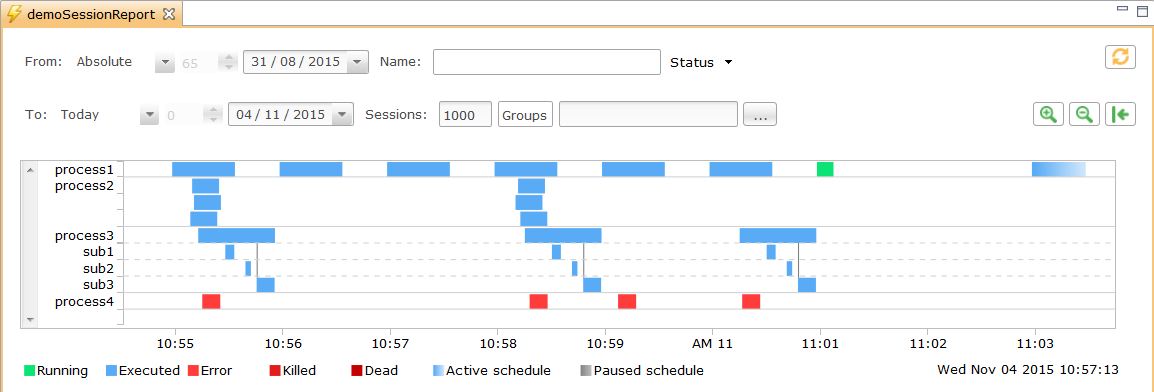
The Timeline tab
The Timeline tab shows session executions over time.
Timeline Navigation
To navigate in the timeline:
-
Maintain the left mouse button pressed and scroll the time window left and right.
To zoom in and out, either:
-
Use the mouse wheel.
-
Double click in an empty space in the timeline.
-
Keep the right mouse button pressed and select the zone you want to zoom in.
-
Use the zoom buttons


To view information about a session, either:
-
Left-click on the session. The session information appear in the dedicated views
-
Double click on a session to open the Session detail
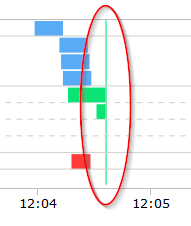
Timeline Legend
-
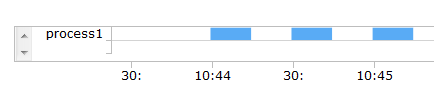
Full line: Normal execution
-
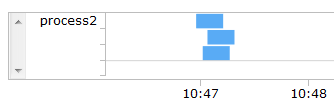
Multiple blank separated lines: Same session executed in parallel.
-
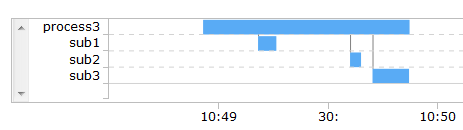
Dotted lines: child sessions
-
Gradation: Sessions scheduled. Semarchy xDM Integrator Analytics analyzes the sessions already executed and estimate the execution time the scheduled sessions. The next fifty schedules are displayed.

-
Current time:
Managing Runtime Engines
The runtime engines defined in the parameters are listed in the Navigator view , under the Runtimes node  .
.
| If the list is empty, check that a profile is selected in the dropdown box under the main menu. |
Runtime Details
Double-click a runtime in the Navigator View to open its editor.
This editor has several tabs:
-
The Monitoring tab displays information about the clients connected to the runtime and about the session threads running in this runtime.
-
The Virtual Machine tab displays real-time information about the Java Virtual Machine running this runtime.
-
The Test tab allows you to perform tests from the point of view of the runtime. You can test an IP route (to assess whether this runtime can access a given host/port) or test the presence of a directory in the file system of the server hosting the runtime.
-
The Purge tab allows you to define purge schedules for the runtime log database. You can add, edit or remove purges as well as configure for each purge how many sessions, days, etc, are preserved and its execution time.
-
The Command tab allows starting commands on this runtime.
Deliveries
The deliveries deployed in a runtime are listed under the runtime in the Navigator view.
Double-click a delivery in the Navigator view to open the editor for this delivery.
In this editor, you can:
-
Execute a delivery by clicking the Execute button in the editor toolbar.
-
View the list of sessions created from this this delivery. You can use criteria to filter the list of sessions.
-
Stop, restart or delete sessions for this delivery through the session popup menu.
| When executing multi-configuration deliveries, a selection dialog opens to choose the configuration to use. |
Scheduling a Delivery
To schedule a delivery:
-
Right-click the Delivery in the Navigator View
-
Select New > Schedule
 . The New Schedule editor opens.
 -
Define the schedule through the Second, Minute, Hour, Day, Month, Year tabs. As you enter information in these tables, the corresponding Cron expression is displayed.
-
Press CTRL+S to save this schedule in the runtime.
| When scheduling multi-configuration deliveries, a selection dialog opens to choose the configuration to use. |
Managing Deployment Managers
Introduction
Semarchy xDM Integrator Analytics uses Deployment Managers to manage the deployment of integration processes. A deployment manager contains packages, versions of deliveries as well as topology and configuration information (connection data, metadata configuration, etc.).
Creating a Deployment Manager
Deployment managers are listed in the Navigator View under the Deployments node  .
.
To create a deployment manager:
-
Right-click the Deployments node
in the Navigator View -
Select New > Deployment Manager

-
Enter a name and then click Finish.
The deployment manager is created and its editor opens.
The Deployment process
In a deployment manager, you can:
-
Import packages generated from the Designer by the integration developers.
-
Define configurations. For instance, production or UAT configurations.
-
Create deployment specifications from packages for specific configurations.
-
Configure the metadata properties for the configurations.
-
Build delivery versions.
-
Deploy delivery versions on runtimes.
-
Manage the versions and their differences.
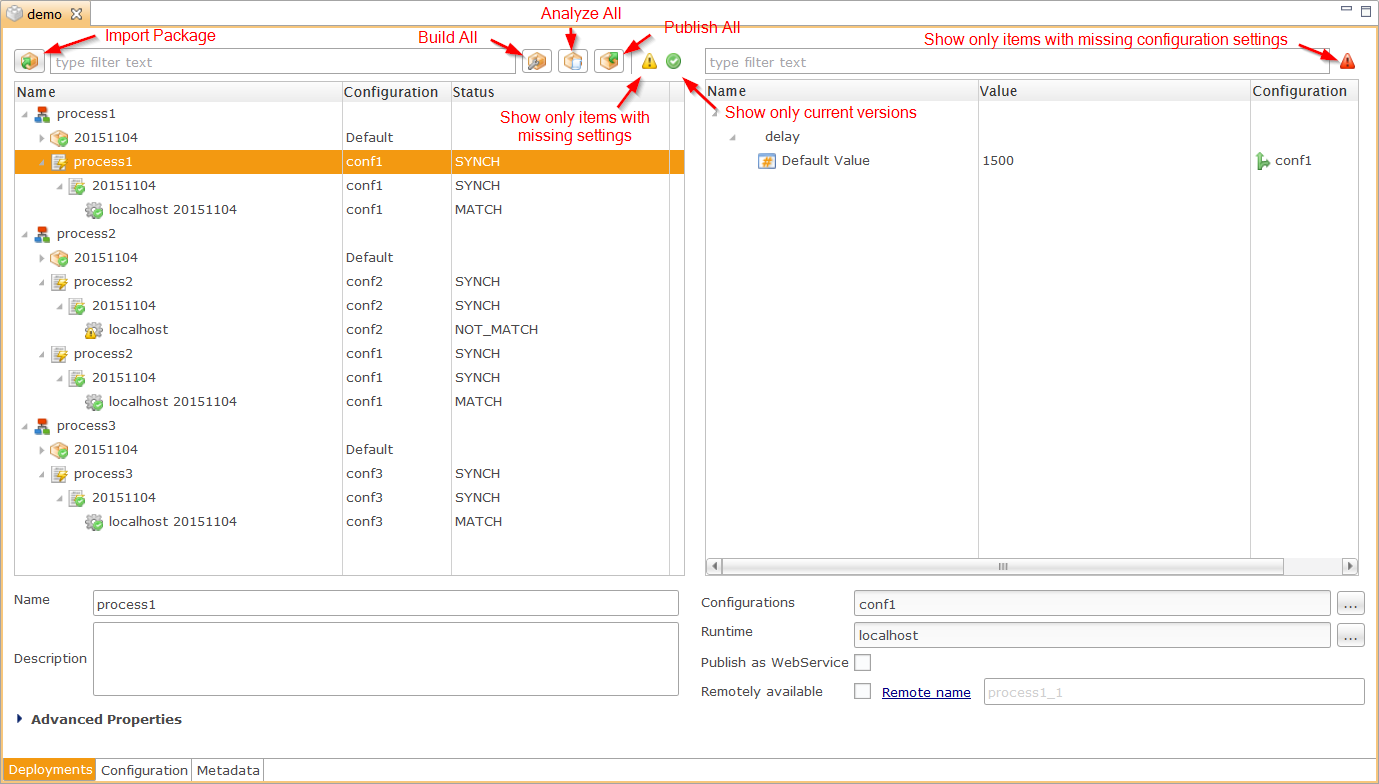
Importing a Package
To import a package:
-
In the deployment manager editor, click the Import
 button.
 -
Browse and select Package file (with the extension .pck).
-
Click OK when the import is complete.
The package  is imported and appears in the deployment manager, attached to a process
  node. Different packages files generated from the same process are attached to a same process node named after this process. The default name of the imported package is the import date.
|
You can define a Path in the properties of the Process node. This allows for organizing processes into folders.
|
Packages generated from the Designer UI are stored in the runtime/build/packages/ sub-directory of the Designer installation directory.
|
Organizing Packages
You can structure your Deployment Manager using virtual folders  .
This allows to organize and arrange your packages under a folder tree.
.
This allows to organize and arrange your packages under a folder tree.
-
Create a folder by clicking on the New Virtual Folder
button.
You can create as many folder/sub-folders as you need. -
Drag and drop your packages into folders to organize them.
|
You can define the path of a package directly in the properties of its root node. When settings the 'Path' property Analytics will automatically create the corresponding folder tree.
|
Defining Configurations
Configurations  store the configuration and the deliveries' metadata.
To define a new configuration:
-
Select the Configuration tab in the deployment manager editor.
-
Click the Add button.
-
Fill the Name field. This name is the unique identifier for the configuration. For example: PRODUCTION, UAT and TEST.
-
Press CTRL+S to save this new configuration.
Compound Configurations
A configuration can be configured to inherit from other configurations with the Parents field.
To define such a configuration:
-
Click the button
 near Parents field.
 -
A dialog opens to select the parent configurations.
| The order of the configurations is important, as the last configuration in the list will have the priority. This is useful to handle configuration exceptions for certain processes, and have a generic configuration for most cases. |
Creating a Deployment Specification
It is possible to create a deployment Specification  from packages using configurations.
To create a deployment specification:
-
Right-click a Process node
and then select New Deployment Specification. -
Click the
button next to the Configurations field. -
Select one or multiple configurations to associate with your specification.
| You associate multiple configurations to a deployment specification. This allows for executing a delivery in different configurations. Do not confuse this feature with the compound configurations. |
Configuring the Metadata Properties
Once the deployment specification is created and associated to one or more configurations, you can configure the metadata properties for these configurations.
If you select a deployment specification, the right part of the editor shows the metadata to configure. An icon indicates whether a metadata property is correctly configured:
-
If the Error icon
appears, the metadata must be configured as no other configuration provides a value. -
If the Configuration icon
appears then the metadata is configured.
| Several packages may share the same metadata. In this case, some metadata would appear as already configured thanks to a previous deployment operation. |
|
You can filter all the properties that require configuration by clicking on the error icon at the top of Configuration table, next to the text filter.
|
To configure the metadata properties:
-
Select in the list the property that you want to configure.
-
In the lower part of the editor, the property appears with a default value imported with the package:
-
Preserve the same value by clicking on the configuration link.
-
Define your own value by filling the text field.
-
-
Repeat the previous steps for each property flagged with the Error icon
-
Press CTRL+S to save the deployment manager editor.
| For compound configurations, all the parents appear in this window. If a value is not set, the value from the parent is used. |
Use the Initialize  top button to set all the missing values to the default package values. top button to set all the missing values to the default package values.
|
Remotely available deliveries
You can set a delivery as Remotely Available. A Runtime configured to access to the Deployment Manager will fetch the latest version of the delivery before executing it.
-
Select a Deployment Specification.
-
Check Remotely Available.
-
Optionally, change the remote delivery name, which by default is the process
name.
Building a Delivery Version
You can build a delivery version when all the metadata properties for this delivery are configured in the deployment specification.
To build a delivery version:
-
Right-click the Deployment Specification node
and then select Build Deliveries.
A new version of Delivery is created under the Deployment Specification node.
| You can build deliveries from any nodes (Specification, Process, Folder, ect) using right-click then Build Deliveries. This creates a Delivery for each child of the node. |
| The metadata configured on a built delivery cannot be modified. If a modification needs to be done, update the Deployment Specification, and build a new version of the delivery. |
Click on the Build All button at the top of the editor  to build all deliveries for the Deployment Manager. to build all deliveries for the Deployment Manager.
|
Deploying a Delivery Version
To deploy a delivery on runtimes, you must first associate one or more runtime engines to the deployment specification.
-
Select the Deployment Specification
-
Click on the
button near the Runtime property. -
A dialog opens to select the runtimes you want to associate to your specification.
Once runtimes are associated to a deployment specification, you can deploy a delivery versions using one of the following methods:
-
From a Delivery:
-
Right-click the Delivery and then select Publish Delivery
-
-
From any node of the tree (Specification, Process, Folder, etc):
-
Select the node, right-click and then select Publish Deliveries.
This opens a dialog to select the delivery to publish and the runtime.
-
-
By downloading a Delivery file to deploy it manually on the Runtimes.
-
Right-click on the Delivery
-
Choose Download Delivery
-
| You can only deploy a delivery on a runtime using a Publish operation if the Runtime is started (on-line) and accessible. |
Click on the Publish All  button to publish all the deliveries of the Deployment Manager. button to publish all the deliveries of the Deployment Manager.
|
Defining Deployment Schemes
Deployment Schemes can be used to automate the configuration of Deployment Specifications.
A Scheme is a pre-configured Specification where you define the Configurations, Runtimes, and options used. After defining a Scheme, you choose to use it on the desired Deployment Specifications using the Deployment Scheme box.
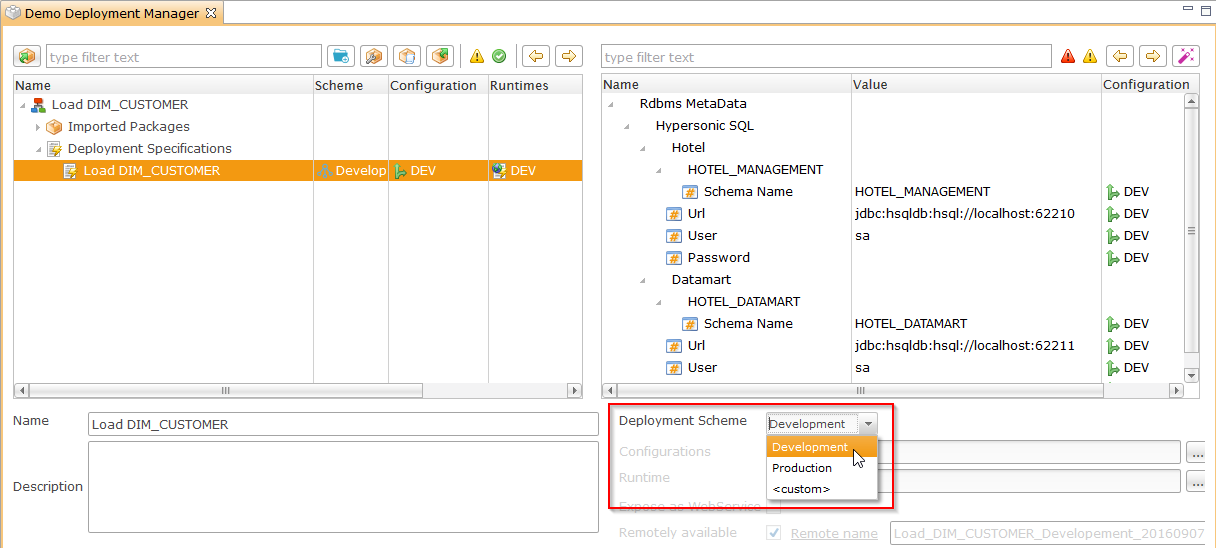
| When updating a Scheme, all the Deployment Specifications using it will be impacted. |
To define a Deployment Scheme:
-
Click on the Deployment Scheme tab in the Deployment Manager
-
Click on the Add button
-
-
On the right side enter the Name used as the unique identifier of the Deployment Scheme.
-
Define the properties accordingly to your requirement: Runtime, Configuration, …
-
Save
The Use as default Scheme property indicates that the Scheme is used for new Deployment Specifications.
The Remote name mask property defines dynamically the remote name of the Specifications using this Scheme. This allows to use the same Scheme on multiple Specifications by using the following masks:
-
[Scheme]: Name of the Scheme. -
[Package]: Name of the Package. -
[DeploymentSpec]: Name of the Deployment Specification.
The masks will be replaced automatically with their values on the Specifications using the Scheme.
You can use the Generate Schemes button to automatically create all the Schemes corresponding to the existing Deployment Specifications. When you click this button, Semarchy xDM Integrator Analytics will generate the Schemes and as you to use these Schemes on the Deployment Specifications.
Managing Versions
Current Version
If you import new versions of an existing package, the latest package becomes the Current Version of the package  , which is the package used to generate the deliveries.
Similarly, if you create a new version of a delivery, the latest delivery version becomes the Current Version of the delivery  , which is the delivery version used for deployments.
Checking for Differences
Changes since the Latest Build
If differences exist between an imported package and the current (latest built) delivery version, a warning icon  appears on the objects (tree nodes and metadata properties). Such a warning indicates that metadata has been changed.
Changes since Latest Deployment
It is also possible to check differences exist between the current (latest built) version and the deployed on runtimes.
Under the current version node the runtimes  are listed with a status icon:
-
A warning icon
appears if differences are found. -
A question mark icon
 will appear if the differences cannot be assessed. It is possible to check manually the differences. Right-click the delivery and then select Analyze.
 -
A checked icon
 will appear if the built delivery and the deployed delivery are synchronized.
To check the differences:
-
Right click on the Runtime under the current version node
and choose Analyze. -
Right click on any node of the tree and choose Analyze Runtimes.
Click on the Analyze All  button at the top to analyze all the runtimes. button at the top to analyze all the runtimes.
|
Reverting to a Previous Version
It is possible to revert to a previous version of a package or a delivery.
-
To change the current Package, click on the Current Package check box.
-
To change the current version, click on the Current Build check box.
The default green icon appears on the selected element.