RunTime Views
Runtime views are used to monitor the runtime components and the execution of the sessions and flows.
Runtime View
The Runtime view allows monitoring a runtime engine.
From this view, you can perform the following operations:
-
Click the Environment button to start and stop a local (pre-configured) runtime engine and demonstration databases.
-
Click the Runtime Editor button to add or modify runtimes. The procedure to create a runtime is described below.
-
Check a runtime is active: Select it in the list and click Ping.
-
Connect to a runtime: Select it in the list and then select Connect. Once a runtime engine is connected, it is possible to view its sessions and issue commands using its command-line console.
-
Select or unselect the Refresh Diagram option. When this option is selected, the diagrams of processes running on the connected runtime are automatically refreshed during execution.
-
Click the Runtime Command button to open the command line console of the connected runtime. From the Console, you can issue commands to the runtime engine. Type
helpin the console to get the list of valid commands.
To create a new runtime:
-
In the Runtime view, click the Runtime Editor button. The Runtime Wizard opens.
-
Select the runtime metadata in which you want to create the new runtime and click Finish. The runtime metadata editor opens.
-
Right-click the Runtimes node in the tree view and select New > Runtime.
-
Enter the following details in the properties editor:
-
Name: User-friendly name for the runtime.
-
Server: Hostname or IP address of the machine where the runtime components run.
-
Port: Port on this machine where the runtime runs.
-
User and Password: Credentials to secure the connection to this runtime.
-
Description: Description of this runtime.
-
-
Press Ctrl+S to save the new runtime’s definition.
Sessions View
The Sessions view displays the list of sessions on the connected Runtime. The following criteria are available to filter sessions:
-
Name: Filter by Process name.
-
Session status
-
Count: Define the maximum number of displayed sessions.
-
My Sessions: Display only the sessions started by the current user.
-
Current Runtime: If the log is shared by several runtimes, return only sessions of the current runtime.
From this view, you can also purge the log by clicking the Delete All and Delete Until buttons.
The list of sessions includes the following session properties:
-
Start Time: Startup day and time of the session.
-
Name: Name of this session.
-
Status: Status of the session.
Status Description Prepared
Prepared but not executed sessions.
Running
Running sessions.
Executed
Executed sessions.
Error
Sessions in error.
Killed
Sessions killed by the user
Dead
Dead sessions, that is sessions that have never finished and are considered as dead by Semarchy xDI Production Analytics
-
Elapsed Time: Duration of the session.
-
Configuration: Configuration used to run the session.
-
ID: Unique identifier of the session.
-
Log Name: Name of the log storing this session.
-
Log Type: Type of the log storing this session.
-
Engine: Name of the Runtime engine processing the session.
-
Guest Host: Name of the host from which the session was initiated.
-
Launch Mode: Method used to start the session: Semarchy xDI:
Launch Mode Description Designer
The session has been executed by Semarchy xDI Designer.
Schedule
The session has been executed automatically by a Schedule.
Web Interactive
The session has been executed from Analytics.
Engine Command
The session has been executed from the Runtime Command utility (e.g. using the
execute deliverycommand).Command-Line
The session has been executed from the command line (e.g. with
startdelivery.bat).Web Service
The session has been executed from the runtime’s REST API or SOAP web services.
Action
The session has been executed from the 'Execute Delivery' Process Action.
Restart
The session has been restarted.
-
Execution Mode: The session’s context of execution:
Execution Mode Description Memory
The session has been executed in memory in the runtime.
Autonomous
The session has been executed outside of the runtime.
Session Detail View
This view displays the details of the session selected in the Sessions view.
Several tabs are available:
-
The Errors and Warning tabs display the list of issues.
-
The Variables tab displays the list of session and Metadata variables.
Standard session variables include:
-
CORE_BEGIN_DATE: Startup day and time of the session.
-
CORE_DURATION: Duration of the session in milliseconds
-
CORE_END_DATE: Day and time of the session completion.
-
CORE_ENGINE_HOST: Host of the runtime engine processing the session.
-
CORE_ENGINE_PORT: Port of the runtime engine processing the session.
-
CORE_ROOT: Name of the process containing the session.
-
CORE_SESSION_CONFIGURATION: Configuration used for this execution.
-
CORE_SESSION_ID: Unique identifier of the session.
-
CORE_SESSION_NAME: Name of the session.
-
CORE_SESSION_TIMESTAMP: Session startup timestamp.
-
CORE_TEMPORARY_FOLDER: Temporary folder for this session.
Statistics View
The Statistics view displays the list of statistics aggregated for the sessions.
The following default statistics are available:
-
SQL_NB_ROWS: Number of lines processed.
-
SQL_STAT_INSERT: Number of lines inserted.
-
SQL_STAT_UPDATE: Number of lines updated.
-
SQL_STAT_DELETE: Number of lines deleted.
-
SQL_STAT_ERROR: Number of errors detected.
-
OUT_FILE_SIZE: Output file size.
-
OUT_NB_FILES: Number of output files.
-
XML_NB_ELEMENTS: Number of XML elements processed.
-
XML_NB_ATTRIBUTES: Number of XML attributes processed.
The variables to aggregate and the related aggregation functions are configurable in the Semarchy xDI > Monitor section of Designer’s preferences (under Semarchy xDI Designer > Preferences).
Step Detail View
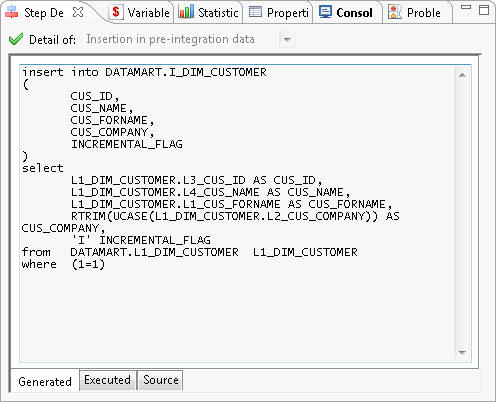
This view displays the details of the steps executed in a session.
It is composed of tabs that display the code at three different stages:
-
Source displays the source code before generation. It comes from the process templates.
-
Generated displays the generated code. It may contain dynamic values replaced before execution.
-
Executed displays the executed code with the variables replaced.
The drop-down-list Detail Of allows you to select one of the iterations of a step that was executed several times.
Variable View
The Variable view displays the variables for the selected step. The list of variables depends on the steps. The following standard variables appear for all steps:
-
CORE_BEGIN_DATE: Startup day and time of the step.
-
CORE_DURATION: Duration of the step in milliseconds
-
CORE_END_DATE: Day and time of the step completion.
-
CORE_BEGIN_ACTION: True if this action is a start action.
-
CORE_NB_ENABLED_EXECUTIONS: Maximum number of executions allowed for this step. This variable is used in loops.
-
CORE_NB_EXECUTION: Number of iterations of this step.
-
CORE_RET_CODE: Return code for this step.