Semarchy xDM Discovery User’s Guide
version 5.2 Rev 1, 2021-04-22
Welcome to Semarchy xDM Discovery.
This guide explains how to use xDM Discovery to perform source data profiling and analyze data when starting your data management initiative.
Using this guide, you will learn:
This document uses the following formatting conventions:
| Convention | Meaning |
|---|---|
boldface | Boldface type indicates graphical user interface elements associated with an action, or a product specific term or concept. |
italic | Italic type indicates special emphasis or placeholder variable that you need to provide. |
| Monospace type indicates code example, text or commands that you enter. |
In addition to the product manuals, Semarchy provides other resources available on its web site: https://www.semarchy.com.
There are many ways to access the Semarchy Technical Support. You can call or email our global Technical Support Center (support@semarchy.com). For more information, see https://www.semarchy.com.
We welcome your comments and suggestions on the quality and usefulness
of this documentation.
If you find any error or have any suggestion for improvement, please
mail support@semarchy.com and indicate the title of the documentation
along with the chapter, section, and page number, if available. Please
let us know if you want a reply.
Semarchy xDM Discovery enables data architects and business users to gather metrics and profile any source data to prepare a data management initiative.
xDM Discovery connects to datasources containing tables, profile the data in the tables and persists these profiles in the Semarchy xDM Repository. Users can analyze these profiles using built-in dashboards available from xDM Discovery.
For advanced profiling, data architect can seed, from the built-in dashboards, fully customizable Semarchy xDM Dashboards applications.
xDM Discovery scans data tables and gathers in the profiles the following metrics:
Using these metrics, data architects have a clear assessment of the data quality. From this assessment, they can discuss and infer the structure and data rules to apply to the data hub entities. xDM Discovery helps in the design phase of the data hub, before and while implementing the model in Semarchy xDM.
xDM Discovery uses the following components:
The xDM Discovery User Interface comes with built-in charts and dashboards to browse the profiles. These charts and dashboards can be forked into Semarchy xDM Dashboards for further customization. Alternately, you can connect a third-party visualization platform to create your own dashboards and visualizations on top of the profiles.
xDM Discovery is installed by default with Semarchy xDM and does not require any specific step after the Semarchy xDM repository installation.
xDM Discovery connects to the data to profile via datasources configured in the application server running the Semarchy xDM application. Make sure to configure these application server datasources pointing to the data to profile before defining them in xDM Discovery.
To access the xDM Discovery user interface, a user must have a role with the Discovery Management platform-level privilege.
Make sure to grant the Discovery Management privilege to the roles allowed to configure datasources and manage profiling processes.
xDM Discovery provides an interface to declare and profile datasources. It is available from the Semarchy xDM welcome page. Click the xDM Discovery icon to open this application in a web browser.
![]()
xDM Discovery appears as shown below:
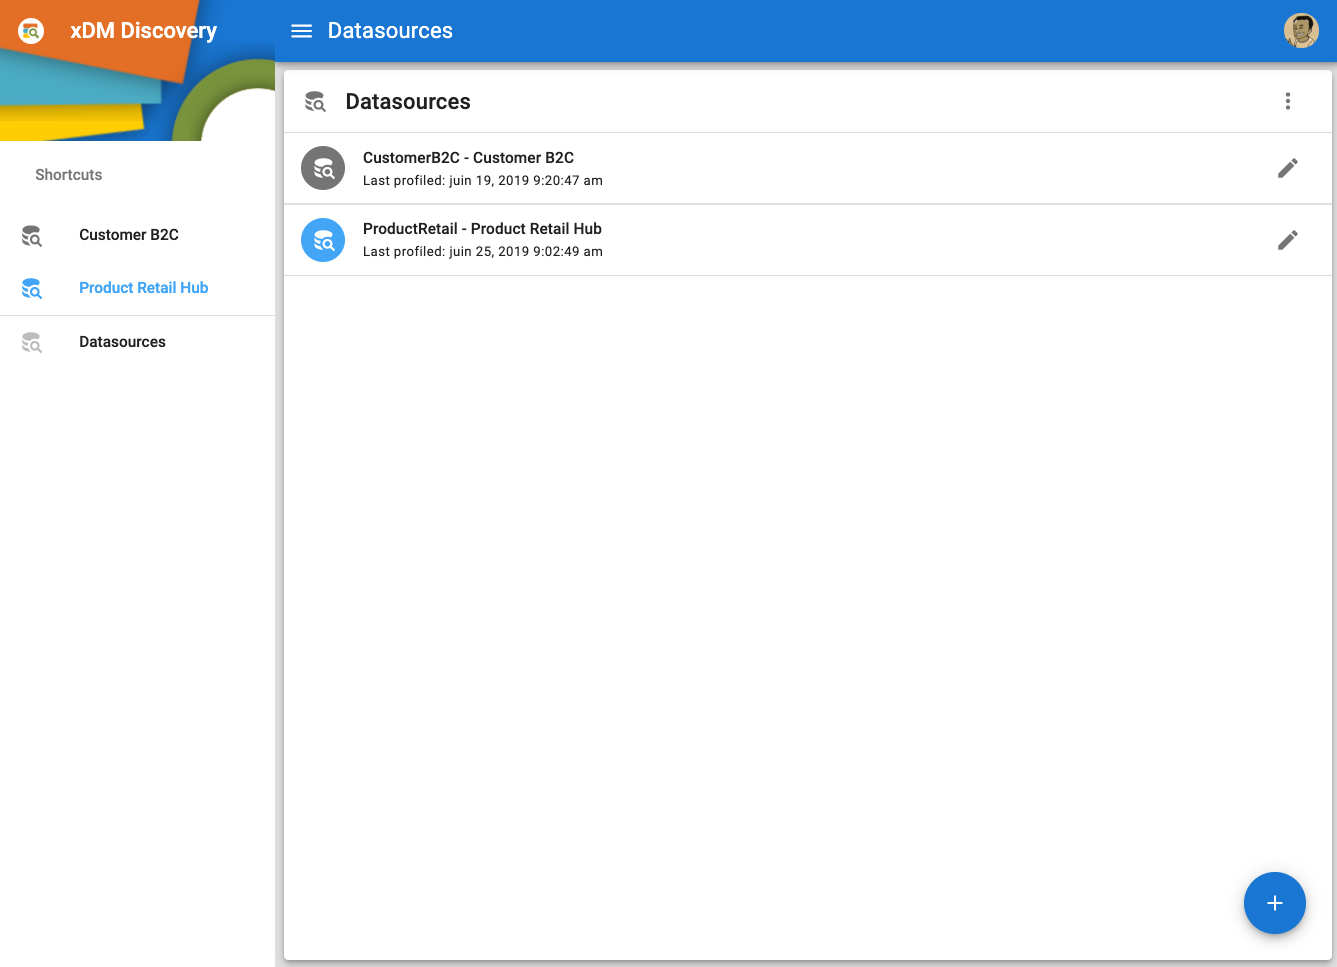
The xDM Discovery interface includes:
 Menu icon to hide/show the navigation drawer.
 user menu.
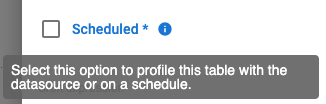
Fields in xDM Discovery are documented within their editor. Move your cursor over the field and click the information icon to display the documentation for each field, as shown below.
Datasources definition and configuration in xDM Discovery are stored in a YAML form: a text representation of the object. You can access for all editors this YAML representation by clicking the  Switch to the YAML editor button in the editor toolbar.
Use YAML editor to quickly modify objects and perform find-replace type of operations.
xDM Discovery provides a built-in validation feature available as a Validate button in each editor’s toolbar to validate the YAML.
This validation displays an issue report describing the various issues found in the datasource definition.
When you connect to xDM Discovery, the datasources list appears:
 Edit action to configure this datasource.
 Table view item in the
  More menu. In the table view:
 Sort menu item.
 Select columns menu item.
Datasources in the datasource list support the following operations:
 View Dashboard to view the datasource profile. Edit to configure the datasource.
 Copy a selected datasource. When copying a datasource, you are prompted for the name of the new datasource.
 Rename a selected datasource. This operation changes the internal name of the datasource and not its label. When renaming a datasource, the incoming references to this datasource are not automatically updated.
 Delete selected datasources. This operation cannot be undone.
 Seed profiling app from a selection of datasource. See Customizing Applications in xDM Dashboards for more information. More menu that is available on each datasource shortcut.
To create a datasource:
The datasource editor opens with the list of tables found in the database.
To configure a datasource:
Open datasource property item in the editor toolbar. Rename button in the sidesheet header and enter a new label for the datasource. Save to save your changes.
The datasource contains the list of tables retrieved from the database at a certain point in time. If you have just created the datasource, or you have added new tables in the database, you can refresh the list of tables.
To refresh the list of tables:
More menu in the upper-right corner of the list of tables. Refresh table list.
The list of tables refreshes:
The list of tables supports the following capabilities:
 Filter button.
To remove tables from the list:
More menu, select  Remove table.
To configure table properties:
Save to save your changes. Edit menu in the More menu.To profile tables:
 Profile selection in the table toolbar.
When a table is the Profiling or Queued status, you can stop its profiling processes by selecting it the list and then clicking  Cancel profiling from the More menu.
When profiling runs for a table, its Profile Status is set to Profiling, followed by a progress percentage. At issue, the table state becomes Ready.
The Last profiled column indicates when the last successful profiling process ran for this table, and the View profile link opens the profile for this specific table.
Only a limited number of tables are profiled simultaneously. This limit is set by the Max processes property in the datasource configuration. If you start profiling more tables, some of them appear as Queued. They are moved to the Profiling state when the previous tables have been profiled.
If the profiling process fails for a table, for example, if the table was dropped from the database, then the status is Failed. A tooltip on the failed status icon shows the error message.
The Profile Status reflects the current state of profiling for each table in the datasource. An empty value reflects a table for which there is no profiling data. Other statuses are:
xDM Discovery includes built-in dashboards to visualize the profiling data.
The Datasource Profile dashboard shows the profiling information at the datasource level. It is available by clicking:
 View profile button in the datasource editor.
This dashboard contains the following tabs:
The Table Profile dashboard shows the metrics from the Table and Column tabs, focusing on a single table of the datasource. It appears when clicking the View profile link for a table from the dashboard editor.
Edit datasource button in the upper left corner to return to the datasource editor.xDM Discovery lets you seed an application in xDM Dashboards that contains the built-in dashboards. You can customize this application in Dashboard Builder and create visualizations specifically for your use case.
To seed a profiling application:
More menu, select Seed profiling app.The generated application contains multiple charts and dashboard, some of which are not used in the application. Feel free to use and customize every component of this application.
You can use your own BI Tool to connect and perform analysis on xDM Discovery profiles:
The Semarchy xDM repository stores the profiling metrics in the tables listed in this appendix. Use this reference information to customize the existing charts or build your own visualizations on top of this data.
This table contains information about the profiling status of the tables.
| Column Name | Description | |
|---|---|---|
| text | Name of the datasource. |
| text | Name of the table. |
| text | Profiling status of the table. Refer to the profiling process section for more information.
|
| number | Progress of a running profiling process (1..100) |
| text | Error message when the profiling process has failed. |
| datetime | Timestamp when the profiling process was queued. |
| datetime | Timestamp when the profiling process was started. |
| datetime | Timestamp when the profiling process was finished. |
This table contains profiling metrics for the tables.
| Column Name | Description | |
|---|---|---|
| text | Name of the datasource. |
| text | Name of the table. |
| number | Number of rows in the tables |
| datetime | Timestamp when the profile was updated. |
This table contains profiling metrics for the columns.
| Column Name | Description | |
|---|---|---|
| text | Name of the datasource. |
| text | Name of the table. |
| text | Name of the profiled column. |
| number | Ordinal position of the column in the table. |
| text | Datatype of the column. |
| number | Number of rows in the table. |
| text | Lowest value found in the column for all records. |
| text | Highest value found in the column for all records. |
| text | Average value found for the column for all records. |
| text | Most frequent value found for the column for all records. |
| number | Minimum value length found for the column for all records. |
| number | Maximum value length found for the column for all records. |
| number | Average value length found for the column for all records. |
| number | Number of null value occurrences found in the column for all records. |
| number | Number of distinct values (different values) found in the column for all records. |
| number | Number of unique values (values that appear once) found in the column for all records. |
| number | Number of records with values unique for the column. |
| number | Number of non-unique values (values that appear two or more times) found in the column for all records. |
| number | Number of records with values non-unique for the column. |
| text | Not loaded yet. Reserved for future use. |
Note that not all metrics are available for all datatypes. The following table lists the metrics available depending on the column datatype.
| Metric | Applicable datatype |
|---|---|
| All |
| text, numeric, date & datetime |
| numeric, date & datetime |
| text, numeric, date & datetime, boolean |
| text, longtext, binary |
| text, numeric, date & datetime, boolean |
| Not available yet. |
Value distribution | text, numeric, date & datetime |
Pattern distribution | text |
This table contains the list of distinct values in the profiled columns.
| Column Name | Description | |
|---|---|---|
| text | Name of the datasource. |
| text | Name of the table. |
| text | Name of the profiled column. |
| text | Column value. |
| number | Number of occurrences of the value found in the table. |
This table contains the list of distinct patterns found in the values of the profiled columns.
| Column Name | Description | |
|---|---|---|
| text | Name of the datasource. |
| text | Name of the table. |
| text | Name of the profiled column. |
| text | Pattern found in the column values. |
| number | Number of occurrences of the pattern in the column. |
| text | Highest value matching this pattern in the column. |
| text | Lowest value matching this pattern in the column. |