| This is documentation for Semarchy xDI 2023.2, which is no longer supported. For more information, see our Global Support and Maintenance Policy. |
Manage Sessions in Analytics
Product users monitor and manage sessions in Semarchy xDI Production Analytics using session reports and rich visualizations.
Session Reports
A session report displays a list of filtered sessions and allows drilling into the session details.
You can create reusable session reports. They may be:
-
Public Sessions Reports, available to all users.
-
Private Session Reports, available only to the connected user under My Session Reports.
Create Session Reports
To create a session report:
-
In the Navigator View, right-click Public Session Reports or My Session Report.
-
Select New Session Report
-
Enter the report Name and then click Finish.
The new session report editor opens. -
Set the filter criteria.
-
Save the editor.
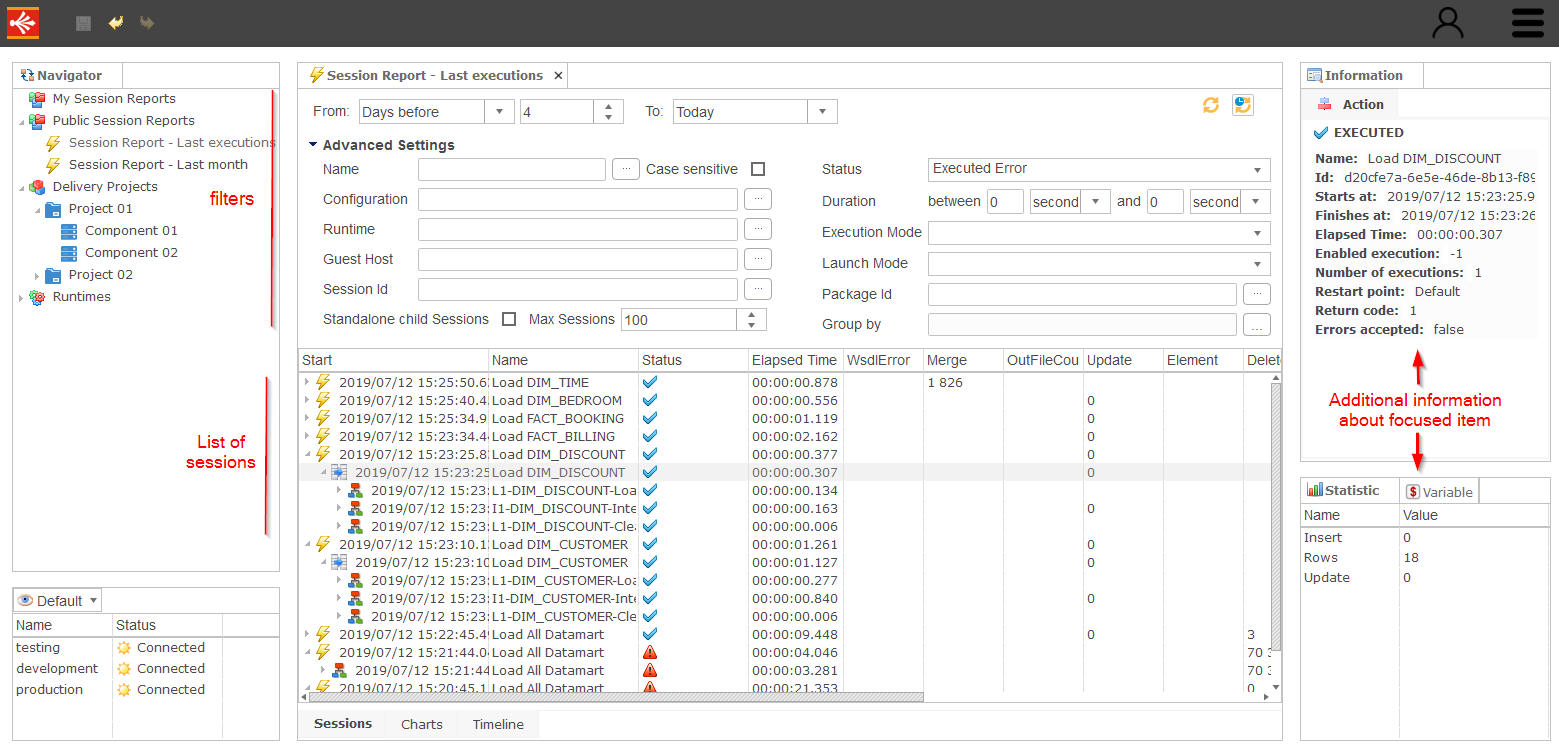
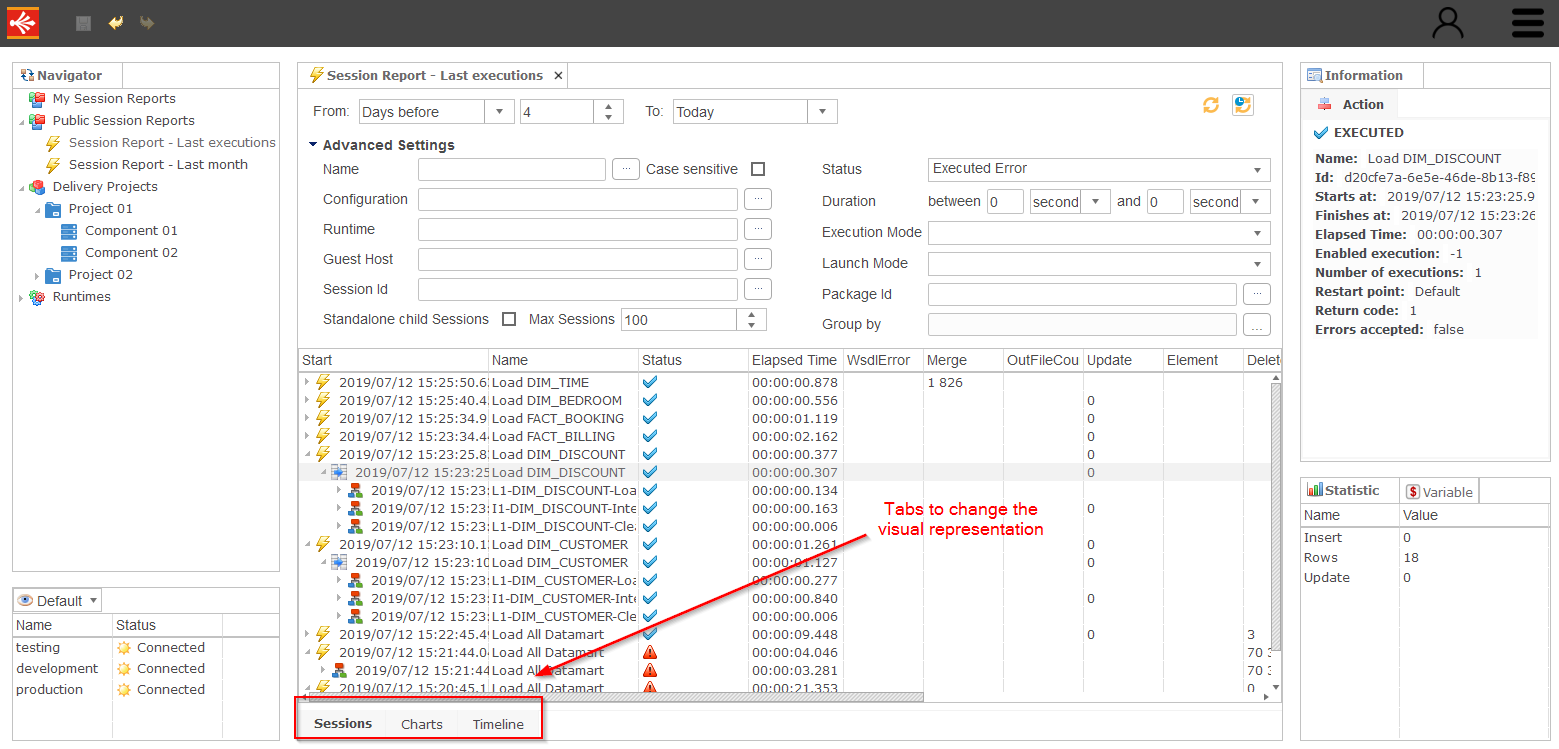
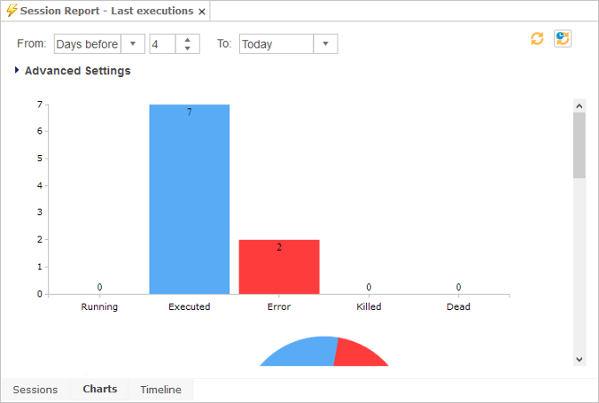
The Session Report Editor
The session report editor provides three visualizations for the sessions. These views appear as tabs at the bottom of the editor.
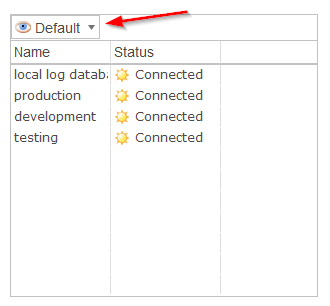
Select the Current Profile
The sessions displayed in the reports are retrieved from the log databases of the runtimes configured in the currently selected profile, runtime or log database.
You can select a profile, a log database, or a runtime in the profile view. If you select a profile, the profile view shows the list of connected runtimes and log databases in the profile.
| Sessions Reports will only retrieve and show sessions from the profile, runtime, or log database selected in the profile. |
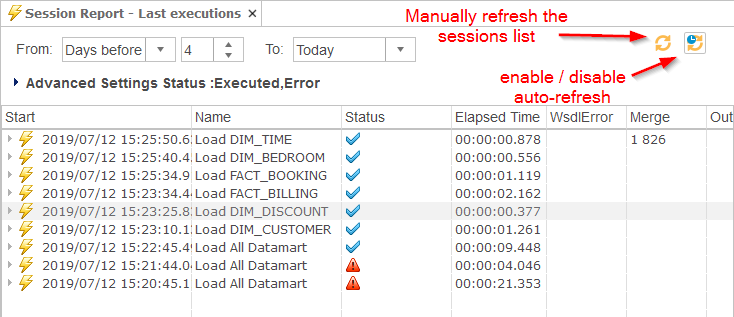
Filter Sessions
You can use the criteria at the top of the editor to filter the sessions of the report:
-
The From and the To parts allow you to set the time range of your report.
-
In addition, the Advanced Settings expose more advanced filter criteria.
Filter Criteria
You can use multiple criteria to filter the sessions. The From and the To parts allow you to set the time range of your report:
-
Today only displays the sessions executed since or until today (depending on which of the two fields From, or To you are using).
-
Yesterday only displays the sessions executed from or until yesterday.
-
Absolute date allows you to define a specific day and time in hours, minutes and seconds.
-
Days before allows you to specify the number of days in the past.
You can also use the criteria and parameters listed below to configure the session report.
| Criteria | Description |
|---|---|
Name |
Session’s name or name pattern. Use the |
Configuration |
Session’s configuration. |
Runtime |
Runtime that executed the session. |
Guest Host |
Hostname of the machine on which the session has been executed. |
Boundary Mode |
Range of sessions to return:
|
Session ID |
Identifier of the session. |
Group By |
Group the sessions according to certain properties: Status, Name, Runtime, Guest Host, Execution Mode, Launch Mode, Configuration. Clicking Group By opens a dialog to add and order the grouping fields. |
Standalone Child Sessions |
If selected, child sessions are displayed in the list of sessions as if they were standalone sessions. |
Status |
Current status of the session:
|
Duration |
Only the session with the specified duration will be displayed. |
Execution Mode |
Execution mode of the session:
|
Launch Mode |
The session startup mode:
|
Package ID |
Identifier of the session’s Package. |
Max Sessions |
Maximum number of sessions displayed in the list. |


The Sessions List
Select the Columns
Right-click the sessions list table header to select the columns that appear in the report.
The displayed columns are saved locally for each user using session cookies. If cookies are not allowed in the browser, changes are discarded when closing the session.
Session List Views
Aside from the sessions list, views display the selected session’s details.
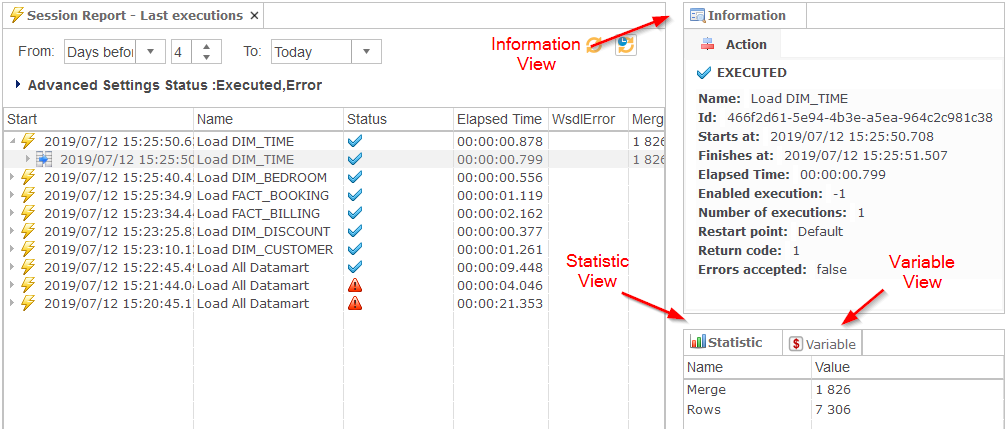
-
The Statistic view shows the aggregated statistics of the session.
-
The Variable view shows the main variables of the session.
-
The Information view shows a session overview.
The Session Details
You drill into a session’s details by double-clicking on that session in the sessions list.
The session’s details appear in a new editor, with the session tree view.
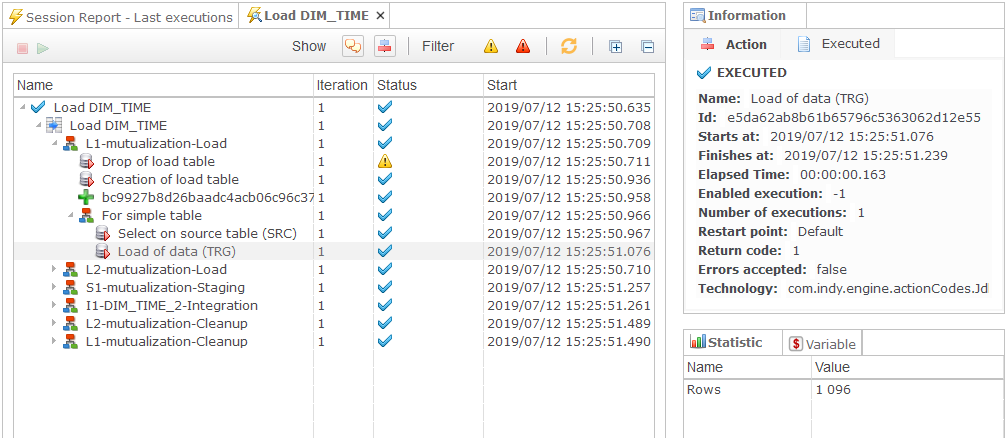
Session Details Views
The Session Details exposes the same views as the Session Report.
Clicking a node in the tree synchronizes the information in the different views with that node.
-
The Statistic view shows the aggregated statistics of the selected step.
-
The Variable view shows the variables of the selected steps.
-
The Information view shows an overview of the selected steps. If the steps contain executed code (for example, a SQL command), it appears in this view in the Executed tab.
The Session Details editor toolbar exposes buttons to manage the session details view:
-
 Message: Display the user messages, defined in the process at design time.
 -
 Details: Show or hide the session details.
 -
 Warnings: Only show the steps with warning messages.
 -
 Errors: Only show the steps with errors messages.
 -
 Stop: Stops the session if it is running.
 -
 Restart: Restart the current session if it is in an error state.
 -
 Refresh: Refresh the session view.
The Timeline
The Timeline tab shows session executions over time.
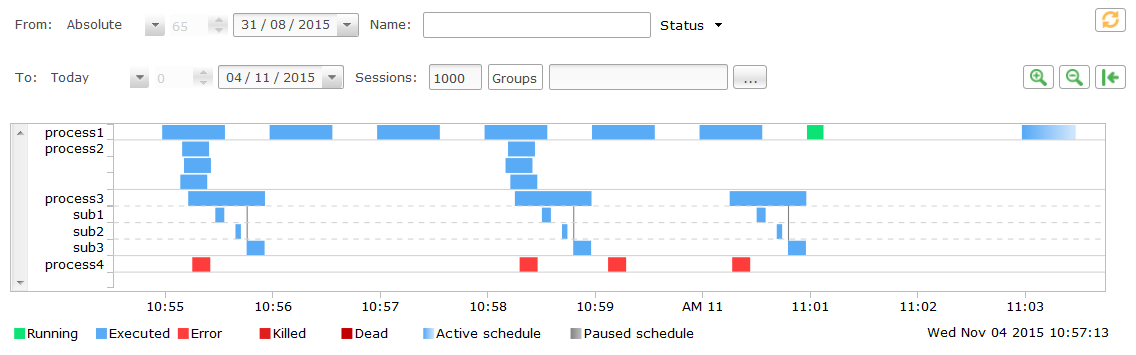
Understand the timeline
The Timeline reflects graphically the session execution.
-
A full lane indicates a normal execution:
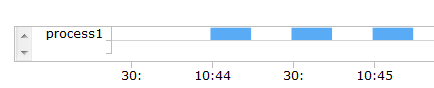
-
Multiple lanes in the same group indicate a similar session running multiple times in parallel:
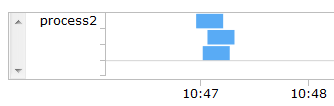
-
Multiple lanes separated by dotted lines indicate child sessions:
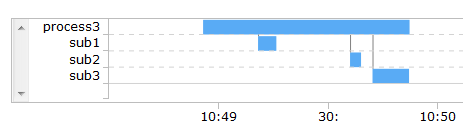
-
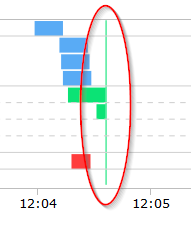
Gradients indicate scheduled sessions, yet to execute:

Semarchy xDI Production Analytics analyzes past executions to estimate and project the scheduled session’s execution time. Note that only the next 50 scheduled sessions are displayed. -
The current time is represented as a vertical line:
Interact with the Timeline
You can perform the following operation in the timeline:
-
Time travel: Click and scroll left and right to move back and forth in time
-
You can Zoom using one of the following methods:
-
Using the mouse wheel
-
By double-clicking on an empty location in the diagram
-
By right-clicking and dragging to select a zoom area.
-
With the Zoom buttons in the toolbar.
-
-
Drilldown into a session:
-
Click on a session. The session information appears.
-
Double-click a session to open the session details.
-
Manage Sessions
Start and Stop Sessions
You can restart or stop a session in Semarchy xDI Production Analytics:
-
In the Sessions Report, right-click a session and select the option to restart or stop the session.
-
In the Session Details, click the Restart or Stop buttons in the toolbar.
View the Process Documentation
If the deliveries executed were built through a package that includes documentation, the sessions are linked to this documentation.
The documentation is available:
-
In the Sessions Report, right-click a session and select the option to open the documentation.
-
In the Session Details, right-click a node in the tree to open the documentation of the specific node (the step in the process).
-
In a Package Manager editor, click the Name of the package manager version in the card to open the version dialog. Right-click on a source package that includes documentation and use the option to view the documentation.