| This is documentation for Semarchy xDM 2023.2, which is no longer supported. For more information, see our Global Support and Maintenance Policy. |
The chart editor
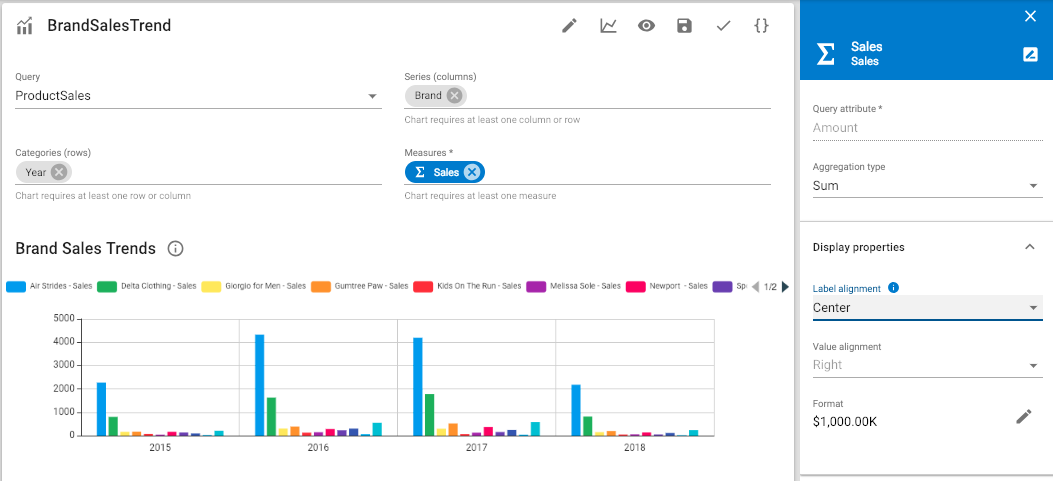
The chart editor is a simple user interface to create all charts in the Dashboard Builder.
Preview
The lower part of the chart editor shows a preview of the chart. This preview changes as you configure the chart.
Toolbar
The editor toolbar provides the following options:
-
 Open/Close Chart properties: Opens/closes the side nav to configure the chart, series and axis properties.
 -
 Chart type: This menu allows changing quickly the chart type. The icon corresponds to the currently selected type.
 -
 Preview opens the chart preview in a new browser tab.
 -
 Save saves the chart.
 -
 Validate validates the chart.
The editor shows in the upper section the following fields:
-
Query, to select a query from the existing queries of the application.
-
Series (Columns), Categories (Rows) to define the dimensions of the chart. Each dimension appears as a chip in this field. Measures to define the measures of the chart. Each measure appears as a chip in this field.
Series, categories, and measures
The series, categories and measures fields simplify the definition of the pivot query according to the select chart type:
-
You can remove, reorder, and move chips within and across fields.
-
Clicking a chip opens the configuration properties of the series, category or measure in the secondary side nav.
-
When the chart requires a category, a series or a measure that is not defined, the associated fields displays an error.
-
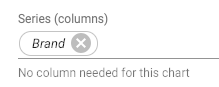
When a category, series or measure is defined but not used by the chart type, it appears in italic with a white background.
When a chart has multiple measures, a specific Measures chip appears in the series. It represents the position where the measures labels are inserted. This chip cannot be removed and has no properties, but may be moved anywhere in the series or categories.