Runtime monitoring and health checks
The Semarchy xDI Runtime uses the Spring Boot Actuator library to expose various Runtime metrics. These metrics can be used to monitor the runtime status and health, and can be accessed via HTTP endpoints that return information in JSON format.
For more information about Actuator monitoring, see the Spring Boot documentation.
Configure the Runtime for metrics
Runtime metrics are enabled by default, but most of them cannot be viewed without proper user permissions. An unauthenticated user can only see if the runtime is currently up, and only from devices the runtime allows.
To access metrics, you need to first create a user for authenticated access, and give the user the Monitor or Admin role.
If you want to modify or disable metrics, set the following two Java properties in the XDI_RUNTIME_OPTS environment variable:
| Property | Description |
|---|---|
|
List of endpoints to expose, as a comma-separated list (such as |
|
List of monitoring system metrics to expose, as a comma-separated list (such as |
Access the metrics
The Spring Boot Actuator library has a specific URL format that starts with /actuator. For example, to check the health of a local runtime open on port 42200, you would use the URL http://localhost:42200/actuator/health.
You can view the list of available metrics and HTTP endpoints, as well as test them, by going to the Swagger UI built into the Runtime:
-
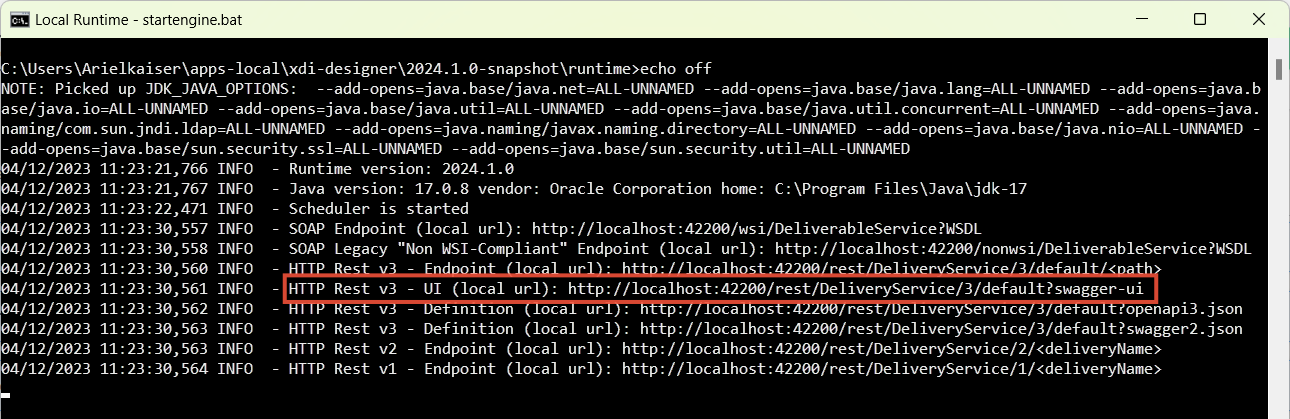
Start your Runtime directly or from xDI Designer.
-
In the command line window that appears, find the URL prefaced with HTTP Rest v3 - UI (local url), and open it in your web browser.
-
Go to the Select a definition dropdown at the top right part of the page, and select monitor.
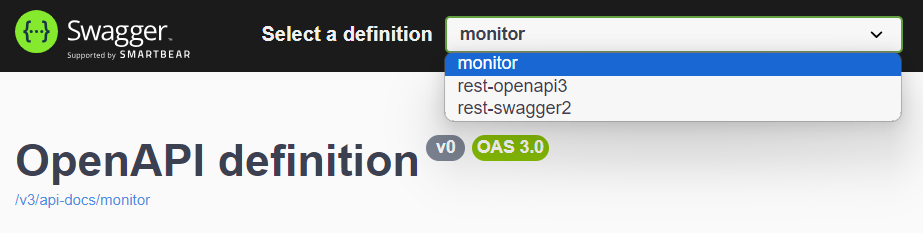
-
The Actuator metrics and endpoints appear on the page.
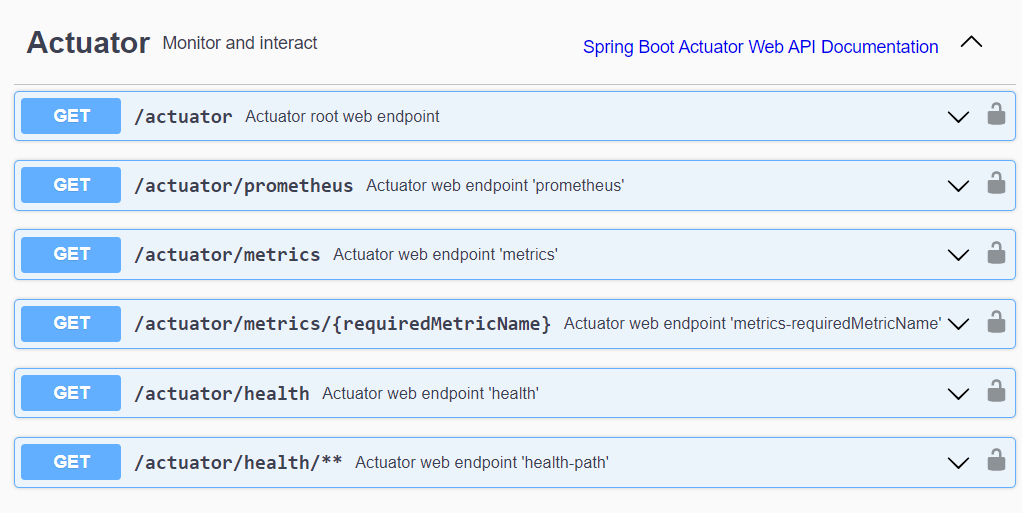
General endpoints
This list is an overview of available endpoints, and is not exhaustive. Consult the Swagger UI for all available options.
| Endpoint | Description |
|---|---|
|
Returns the list of all available endpoints, including itself. |
|
Global health endpoint. For authenticated users, returns information about:
For unauthenticated users, only returns UP or DOWN status. |
|
Global metrics endpoint. By itself, returns a list of metric names that can be used by appending the name to this endpoint in the format Invoking a metric by name returns data containing the metric name, description, value, unit of measurement, applicable tags, and other ancillary information. |
|
Quartz Scheduler endpoint. Use this endpoint to retrieve information about schedules and jobs. You can invoke it when the scheduler is active, in a few ways:
Invoking a metric by name returns data containing the metric name, description, value, unit of measurement, applicable tags, and other ancillary information. |
|
Returns metrics and health information in other formats, as needed by specific monitoring systems. |
Monitoring software endpoints
| Monitoring system | Actuator endpoint | Usage |
|---|---|---|
Prometheus |
|
Invoke to retrieve metrics in a line-based format for the Prometheus monitoring tool. |
Kubernetes |
|
Actuator detects Kubernetes deployments automatically, and activates these health endpoints. Their data is also available from the global health endpoint. |
Examples
In the following examples, all URLs and responses were taken from a local xDI Designer runtime.
Root endpoint
http://localhost:42200/actuator/
{
  "_links": {
    "self": {
      "href": "http://localhost:42200/actuator",
      "templated": false
    },
    "health-path": {
      "href": "http://localhost:42200/actuator/health/{*path}",
      "templated": true
    },
    "health": {
      "href": "http://localhost:42200/actuator/health",
      "templated": false
    },
    "prometheus": {
      "href": "http://localhost:42200/actuator/prometheus",
      "templated": false
    },
    "metrics-requiredMetricName": {
      "href": "http://localhost:42200/actuator/metrics/{requiredMetricName}",
      "templated": true
    },
    "metrics": {
      "href": "http://localhost:42200/actuator/metrics",
      "templated": false
    }
  }
}
Health check
http://localhost:42200/actuator/health
{
  "status": "UP",
}{
"status": "UP",
"components": {
"diskSpace": {
"status": "UP",
"details": {
"total": 1022086868992,
"free": 867966222336,
"threshold": 10485760,
"path": "C:\\Users\\Semarchy\\apps\\xdi-designer\\2024.1.0\\runtime\\.",
"exists": true
}
},
"ping": {
"status": "UP"
}
}
}